Data Insights
Real-time EV Charging Analytics
Track utilisation, uptime, revenue, and faults across every site and socket. No exports, no waiting for a monthly report.
- 99.999%Uptime
- +1 MillionMonthly Charging Sessions
- +100 000Connected Charge Points









What is Data Insights?
eMabler's Data Insights is your command centre for EV charging operations. It gives you real-time dashboards and performance analytics, from high-level fleet trends to socket-level diagnostics, so you can spot issues early, optimise performance, and make smarter decisions without relying on third party tools.
Most Operators Are Working in the Dark
When data is delayed, disconnected, or incomplete, it becomes impossible to act in time. Most operators rely on manual checks, outdated spreadsheets, or scattered systems to track network health. That means problems are usually discovered after the customer has noticed them. Without visibility, you can't respond quickly, and you certainly can't plan ahead with confidence.
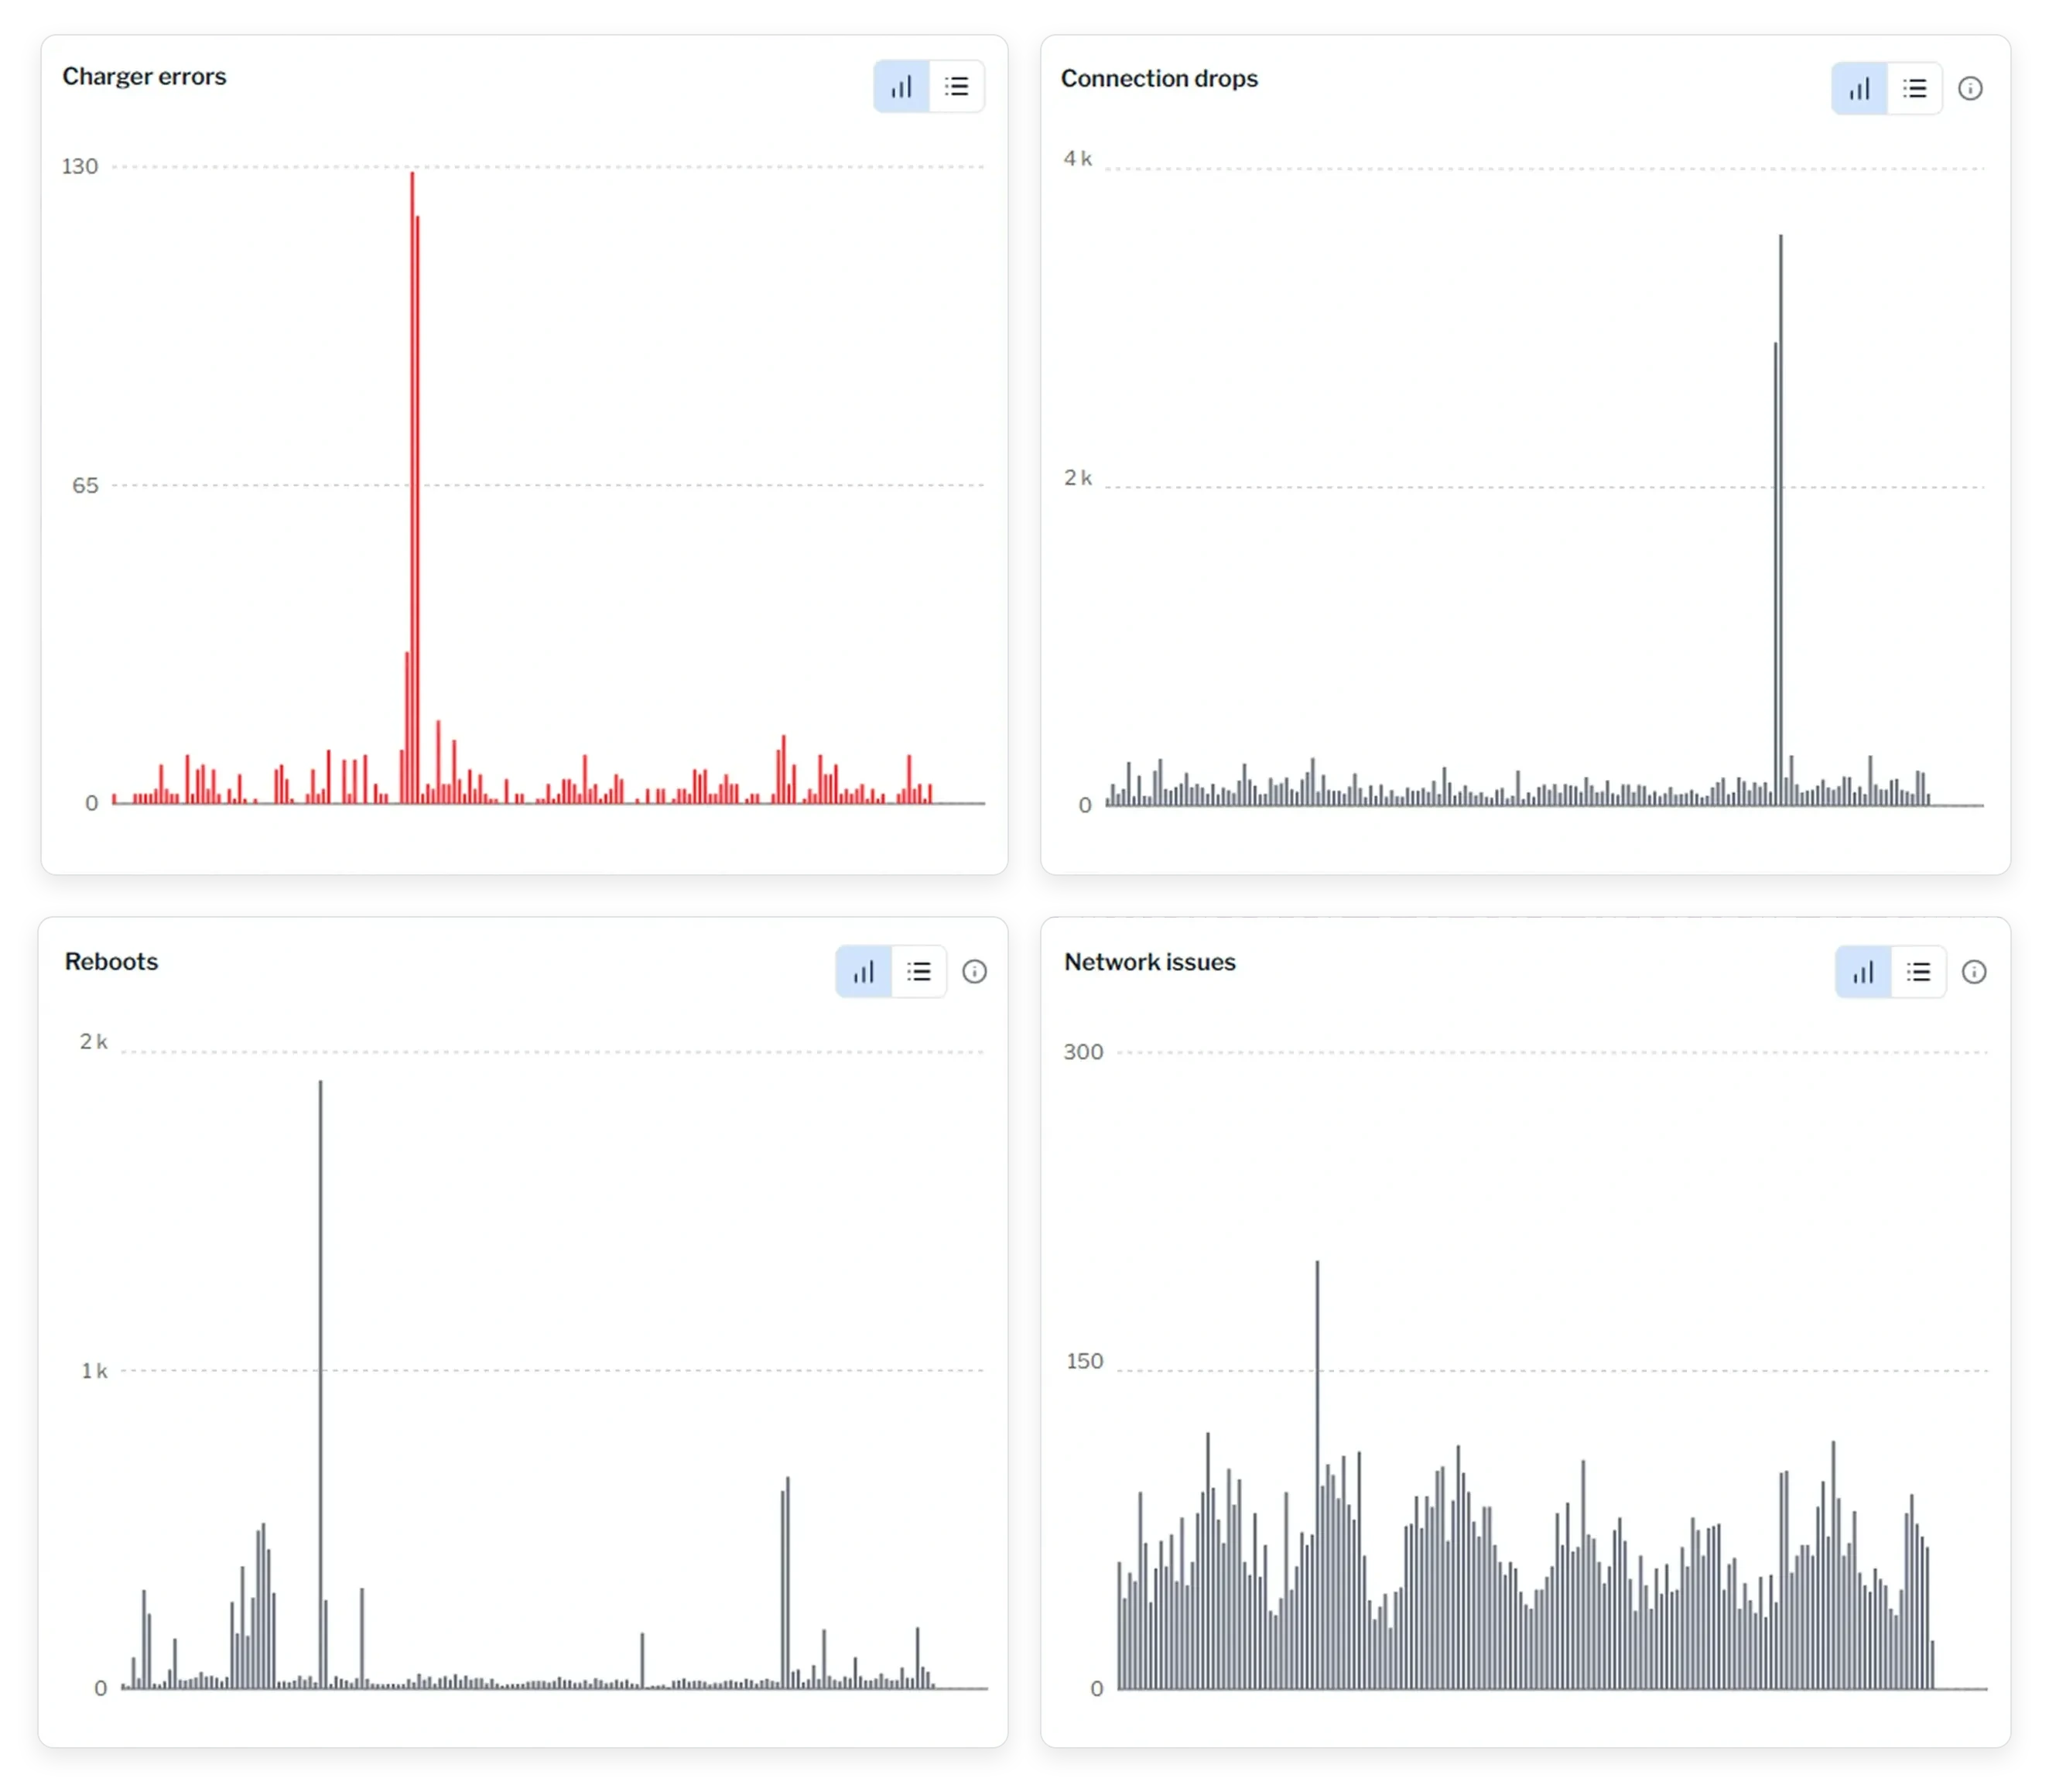
The Whole Network in One View
Data Insights puts the entire network in one view, giving your team the clarity to act early and operate efficiently. You can track socket availability, session success rates, utilisation trends, energy consumption, and recurring errors, site by site, charger by charger.
With the right insights at your fingertips, you reduce downtime, avoid surprises, and improve the charging experience for your end users.
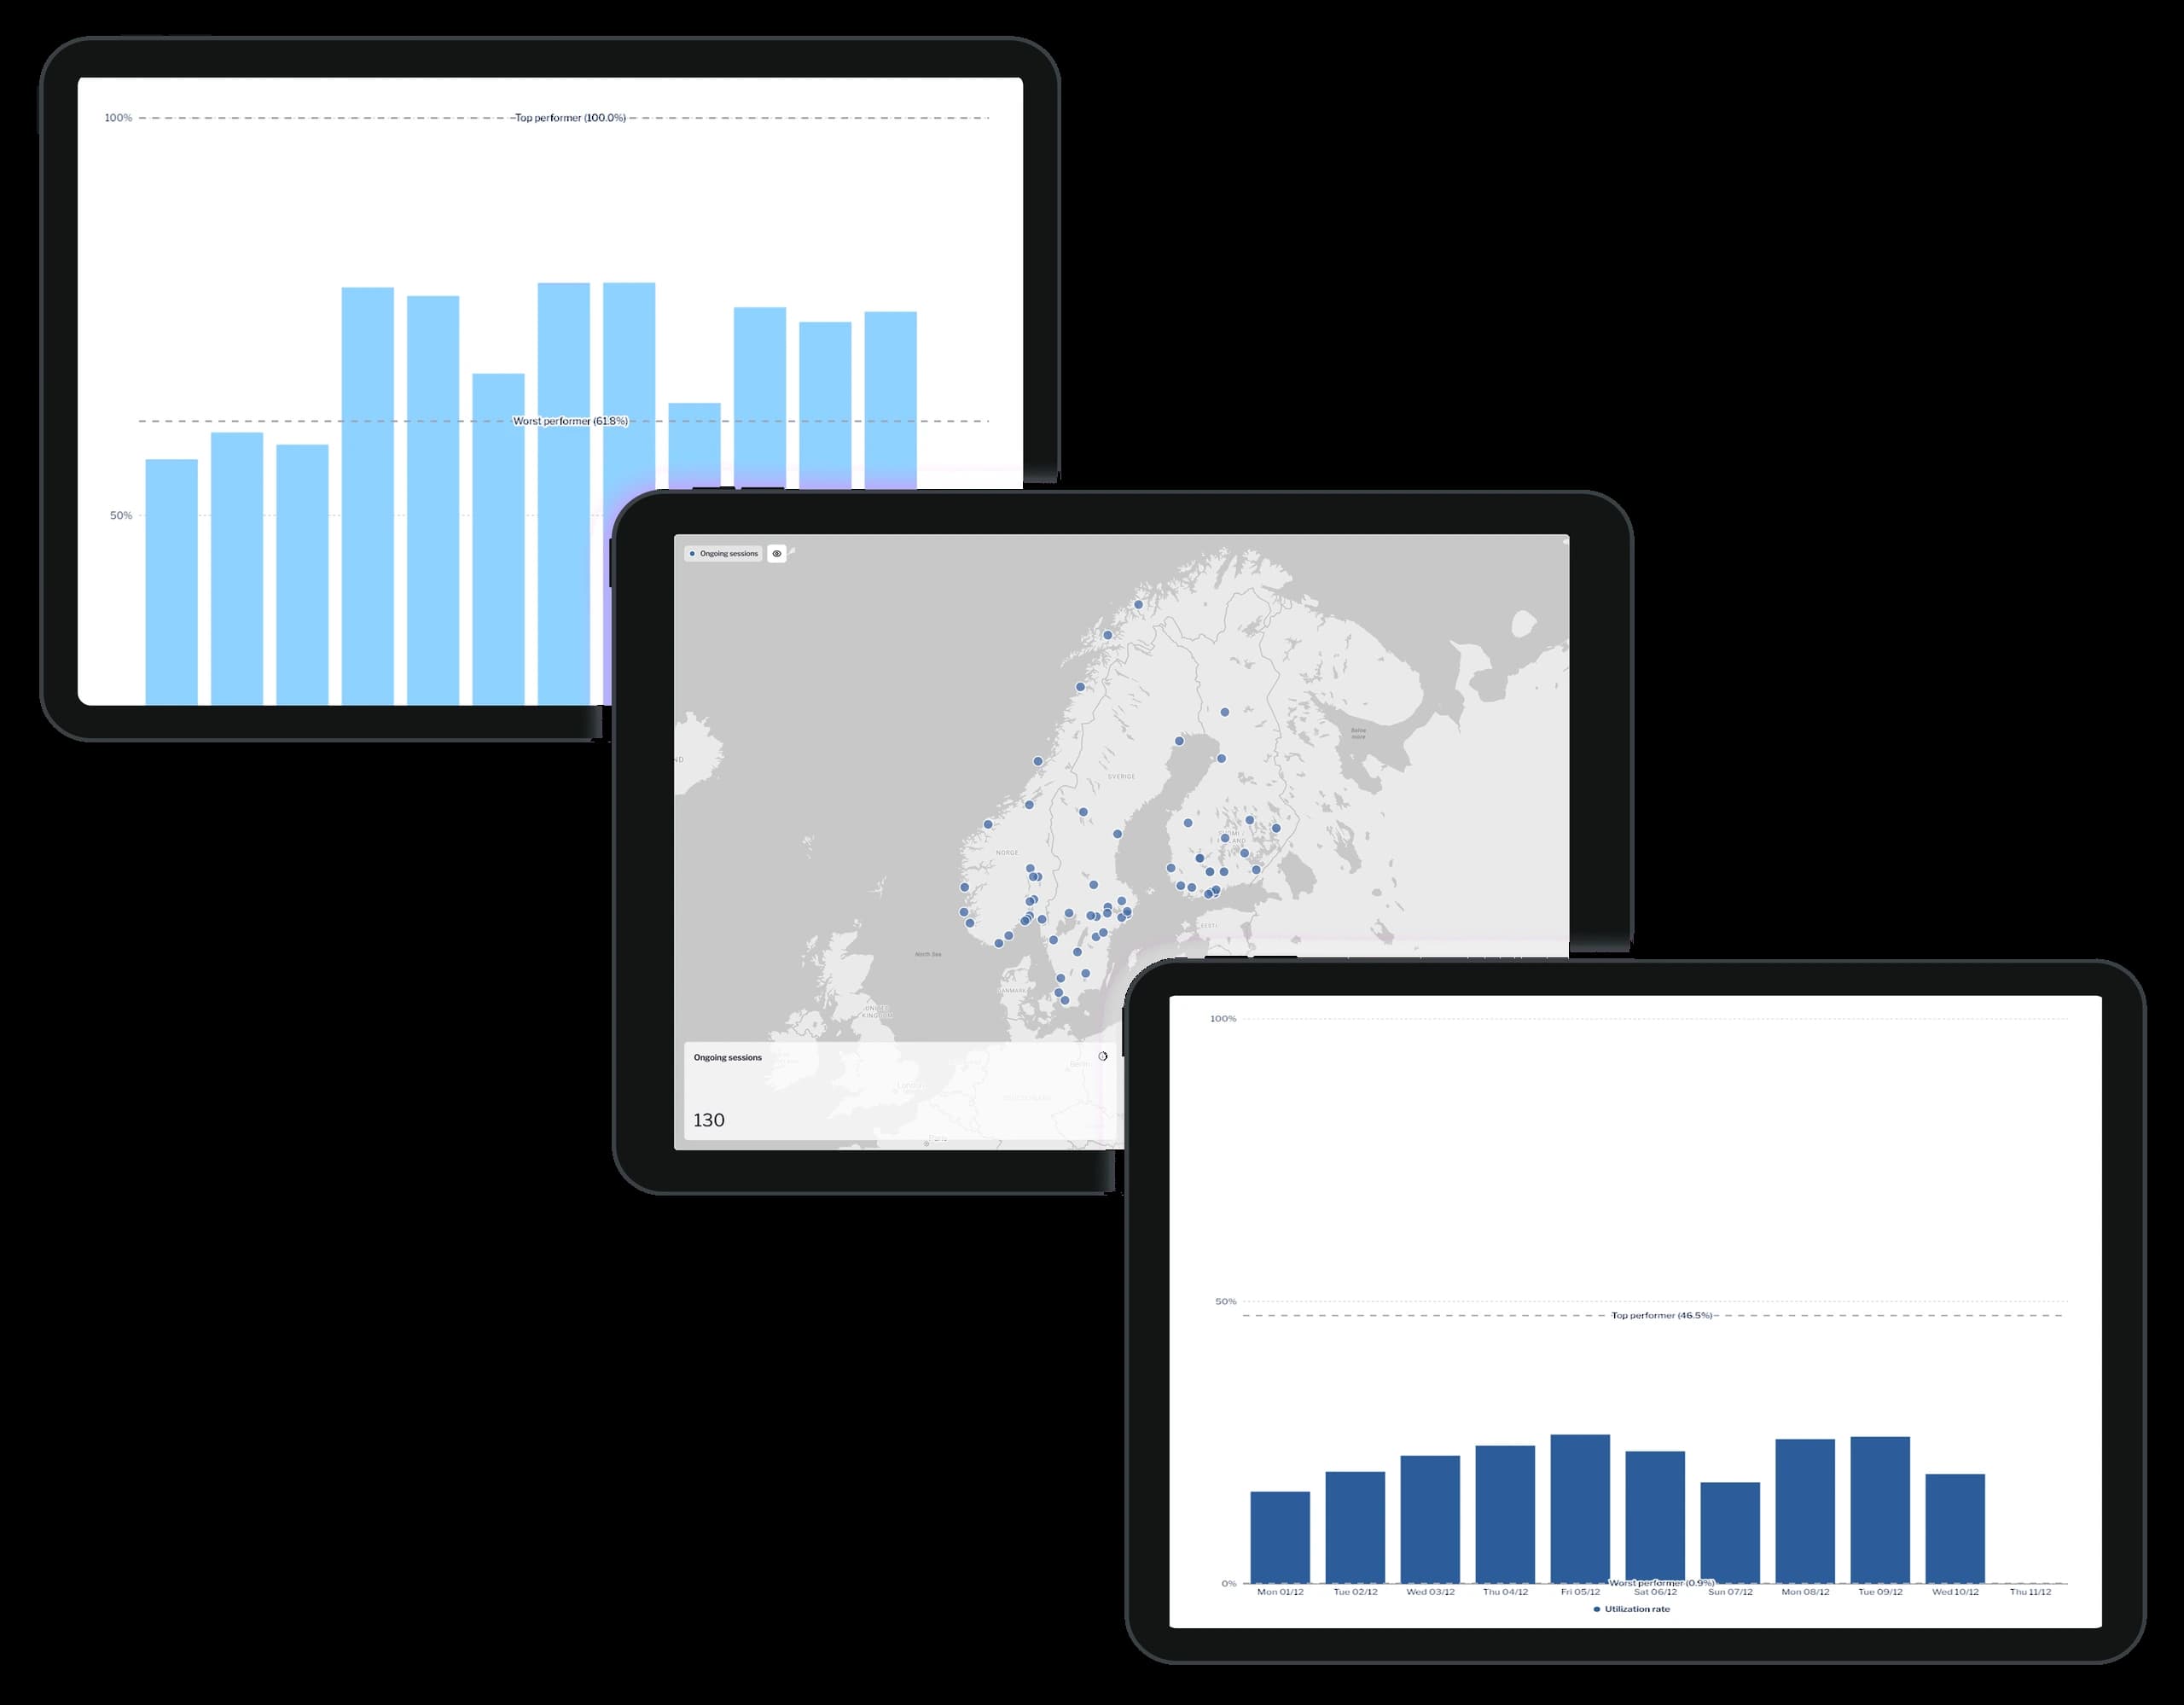
From Full View to Fine Detail
Data Insights shows you what's happening across your entire charging network, and lets you dig into each charger when it matters the most.
Company-Level DashboardA real-time overview of all chargers, sockets, and sites.
Track socket status, utilisation trends, and session success across your network. Spot issues instantly through live metrics, connection stability monitoring, and an interactive map that flags offline or underperforming locations.
Charger-Level DashboardA focused view of each charger's performance.
See real-time socket activity, energy delivered, and session outcomes. Quickly detect recurring errors with 24-hour event history and weekly performance data, ideal for troubleshooting and local optimisation.
Deeper InsightsApply filters, drill down on data, or export data.
You can use flexible time filters, drill down by site, charger type, or error code, and export the data you need for forecasting, reporting, and operational planning. Ideal for teams ready to turn raw data into long-term strategy.
Know What's Happening, Exactly Where It Happens
Energy companies, retailers and parking operators all run Data Insights across their sites. Whether you manage a national network or keep local operations running, you can use the same view.
Executives, Product & Operators
See exactly what's happening across every site, charger, and socket. Track performance, detect issues early, and get the insight you need to keep your ecosystem stable and scalable.
Sales & Customer Service
Get straight to the root cause with real-time diagnostics and per-charger analytics. No more digging through scattered systems or waiting for tickets, your tools are right where you need them.
What the Numbers Look Like in Practice
Charging as part of the Neste experience
A petrol retailer running charging through its own app, keeping ownership of the customer data and the reporting that comes with it.
Read the storyArticleWhy Is My EV Charging Utilisation Rate Low and How Do I Fix It?
Utilisation rate is the number on this page that decides whether a site pays for itself. What drags it down, and what to do about each cause.
Read the articleDocumentationData Insights: technical documentation
What each figure counts, how it is calculated, and how to pull the same data through our APIs into the reporting tools you already run.
Read the docs